Plot the inferential trajectory of a comparison
Source:R/autoplot.R
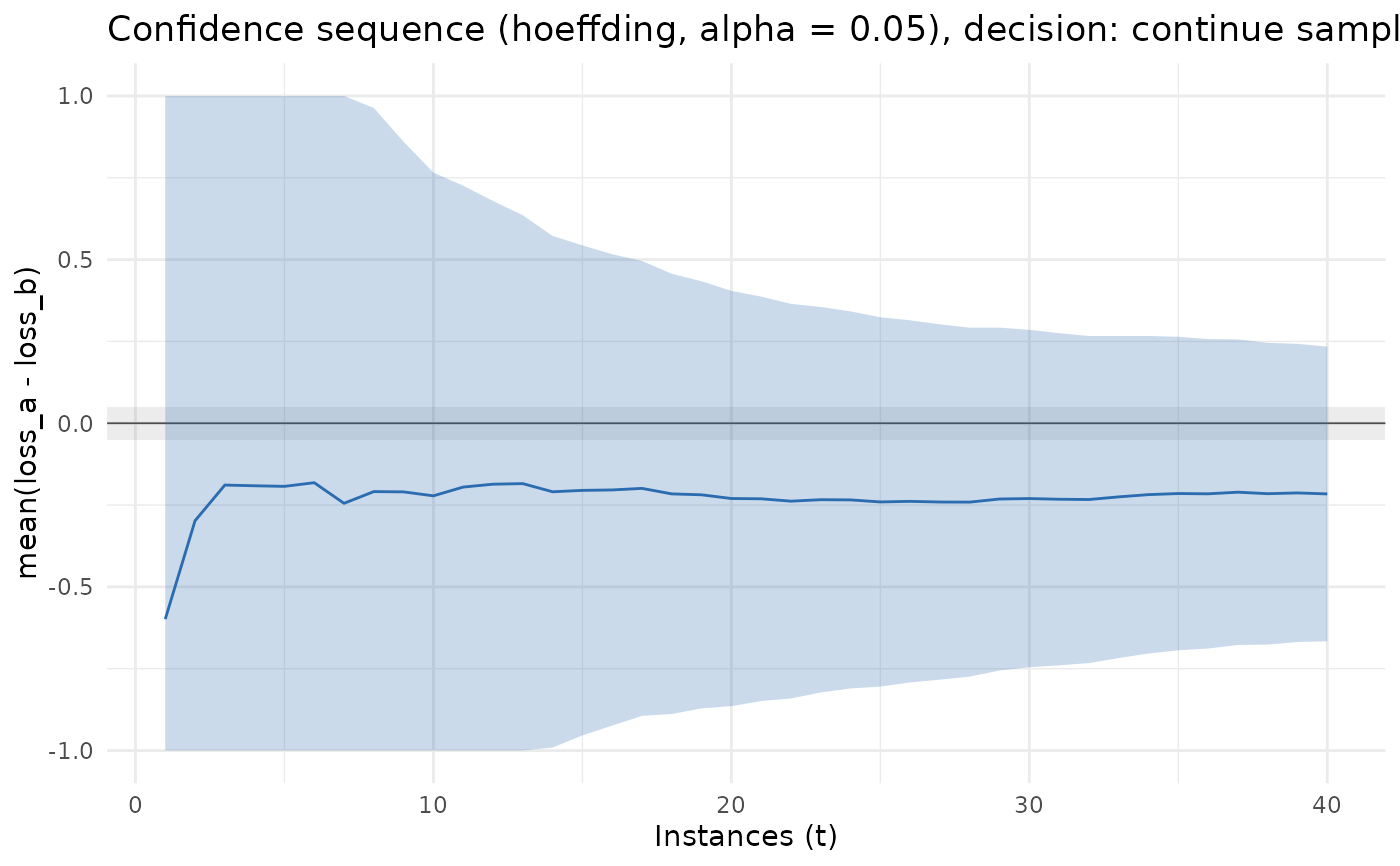
autoplot.seqbench_comparison.RdRunning-intersection confidence sequence for the mean paired difference
against the number of instances, with the equivalence band
[-margin, margin] and the zero line.
Examples
design <- comparison_design(margin = 0.05, bounds = c(0, 1), boundary = "hoeffding")
set.seed(2)
losses <- data.frame(instance = 1:40, loss_a = runif(40, 0, .5), loss_b = runif(40, .2, .7))
state <- update_comparison(initialize_comparison(design), losses)
ggplot2::autoplot(state)