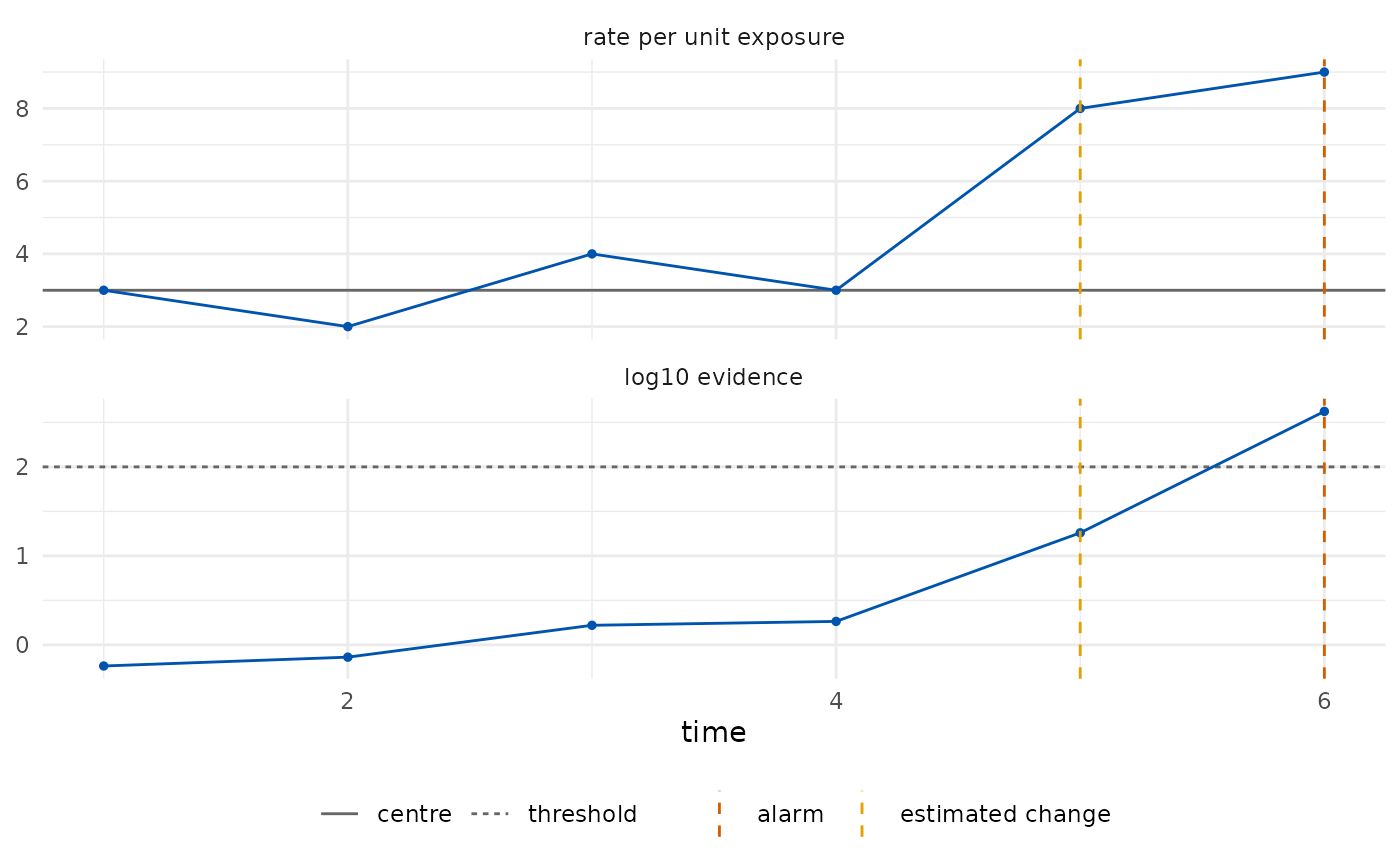
Two panels: the observations (as values, proportions or rates per unit exposure) with the pre-change centre, and the evidence of the detector on the log10 scale with the alarm threshold and, if any, the alarm time and the estimated change point.
Usage
# S3 method for class 'edetect_chart'
autoplot(object, ...)