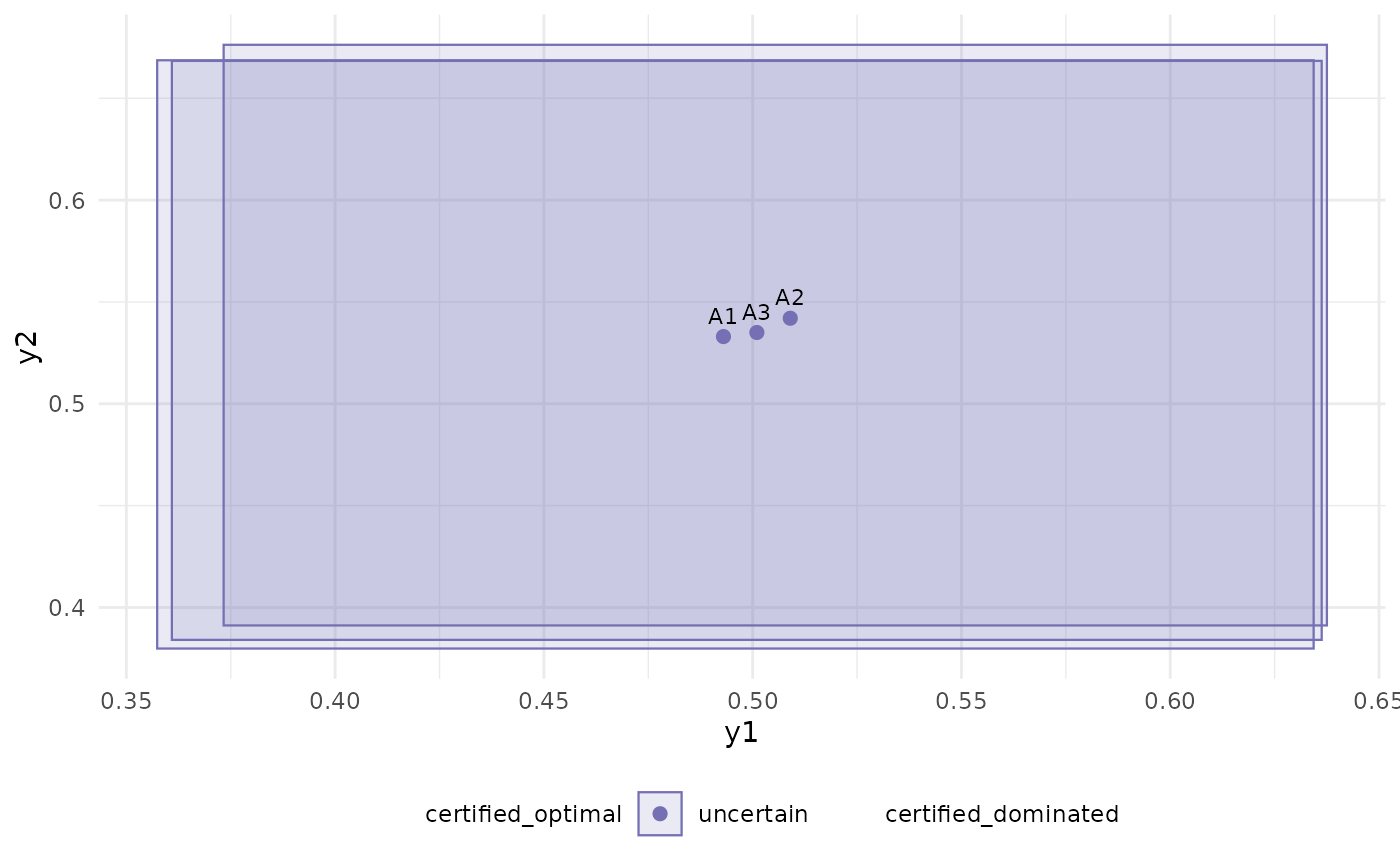
Draws, for two objectives, the simultaneous confidence box of every
alternative (the product of its two running intersections), its point
estimate, and the estimated frontier. The boxes correspond to the actual
guarantee: with probability at least 1 - alpha every true mean vector lies
in its box at every time. Alternatives are coloured by status.
Examples
design <- pareto_design(alternatives = 3, objectives = 2, bounds = c(0, 1), epsilon = 0.05)
set.seed(1)
ev <- tibble::tibble(alternative = rep(c("A1", "A2", "A3"), each = 40),
                     y1 = runif(120, c(0.1, 0.5, 0.6), c(0.3, 0.7, 0.8)),
                     y2 = runif(120, c(0.6, 0.1, 0.6), c(0.8, 0.3, 0.8)))
initialize_pareto(design) |>
  update_objectives(ev) |>
  autoplot()