
A sampling package must earn trust the design-based way: the inclusion probabilities it claims must be the ones it delivers. This vignette checks the package’s promises by simulation — every number below is recomputed when the vignette is built.
The sample size is always exact
Not on average: always. Ten thousand selections, every one with exactly the expected hits it was asked for.
frame <- data.frame(size = rlnorm(150, 2))
n_hits <- replicate(10000, {
  s <- chromy_sample(frame, n = 23, size = "size")
  sum(s$sample$hits)
})
table(n_hits)
#> n_hits
#>    23
#> 10000
Expected hits are delivered
For each unit, the fraction of selections in which it was hit must converge to its expected hits. The largest absolute deviation over the whole frame, against the Monte Carlo error it should sit within:
lambda <- expected_hits(frame$size, 23)
hits <- matrix(0L, 4000, nrow(frame))
for (r in seq_len(nrow(hits))) {
  s <- chromy_sample(frame, n = 23, size = "size")
  hits[r, s$sample$unit] <- s$sample$hits
}
observed <- colMeans(hits)
mc_se <- sqrt(lambda * (1 - lambda) / nrow(hits))

max(abs(observed - lambda))
#> [1] 0.01554681
max(abs(observed - lambda) / pmax(mc_se, 1e-6))   # in Monte Carlo SEs
#> [1] 2.430212
plot(lambda, observed,
  xlab = "expected hits", ylab = "observed frequency",
  pch = 16, col = "#35508C88", cex = 0.7
)
abline(0, 1, col = "#D9962E", lwd = 1.5)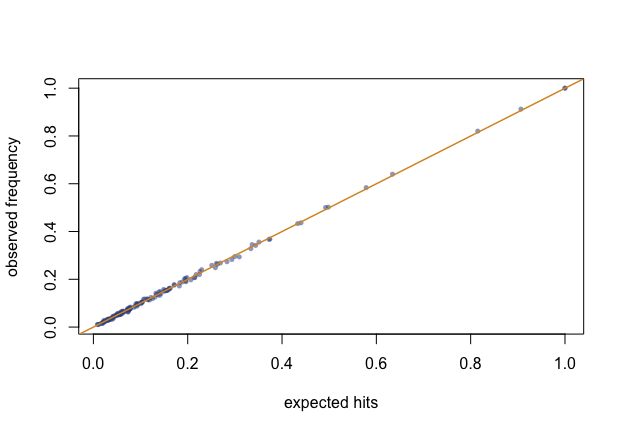
Figure of the chunk unbiased-plot
Minimum replacement holds
Hits never stray further than one from the expectation, including for units expected more than once:
heavy <- data.frame(size = c(900, 500, rlnorm(60, 2)))
ok <- replicate(2000, {
  s <- chromy_sample(heavy, n = 12, size = "size",
                     min_replacement = TRUE)
  all(s$sample$hits == floor(s$sample$expected_hits) |
      s$sample$hits == ceiling(s$sample$expected_hits))
})
all(ok)
#> [1] TRUE
The estimator is unbiased and the variance honest
The multiplicity estimator must centre on the true total; the successive-difference variance has no unbiasedness to promise under a systematic-like design, but it should sit near the Monte Carlo variance — and err on the conservative side when the serpentine order carries real structure.
pop <- data.frame(
  stratum = rep(sprintf("s%02d", 1:10), each = 30),
  size    = rlnorm(300, 2)
)
pop$y <- 50 + 10 * pop$size + rnorm(300, sd = 15)
truth <- sum(pop$y)

runs <- t(replicate(2000, {
  s <- chromy_sample(pop, n = 50, size = "size",
                     order_by = c("stratum", "chromy_size"))
  e <- estimate_total(s, "y")
  c(total = e$total, var = e$se^2)
}))

c(
  relative_bias   = mean(runs[, "total"]) / truth - 1,
  empirical_var   = var(runs[, "total"]),
  mean_sd_var     = mean(runs[, "var"]),
  variance_ratio  = mean(runs[, "var"]) / var(runs[, "total"])
)
#>  relative_bias  empirical_var    mean_sd_var variance_ratio
#>   5.229982e-04   2.682902e+06   4.660619e+06   1.737156e+00
A ratio near one says the successive-difference variance is a fair report; above one, a conservative one.
The reference implementation
The package was distilled from a reference R implementation, kept
verbatim in the test suite
(tests/testthat/helper-reference.R) as an oracle: given the
same seed, chromy_sample() must reproduce it draw for draw
— the same head, the same uniforms, the same hits — across size-column,
multivariate, serpentine, nested, residual-head and minimum-replacement
designs. The Rust engine is itself pinned to the same reference by
golden fixtures (tests/golden.rs in
chromy-core), with the integer outputs exact and the
floating-point outputs at machine precision. That check has been run
against SAS itself: the validation/sas folder of the
repository holds a frame of 60 units run through
PROC SURVEYSELECT METHOD=PPS_SEQ (SAS 9.4, 2000 seeds) and
through this package. The expected hits agree to export precision (SAS’s
PPS_SEQ is pure minimum replacement, min_replacement = TRUE
here; certainty resolution is SAS’s separate CERTSIZE=
option), the serpentine order agrees position for position, every SAS
run has the exact sample size within the minimum-replacement bounds, and
the observed hit frequencies sit within Monte Carlo error of the
expected hits — five checks of five. A Stata user can run the same
comparison against ppschromy; the designs agree in
distribution, though not draw for draw, since each system consumes its
own generator.