Plot the routes
Usage
# S3 method for class 'fieldopt_routes'
autoplot(object, ...)Value
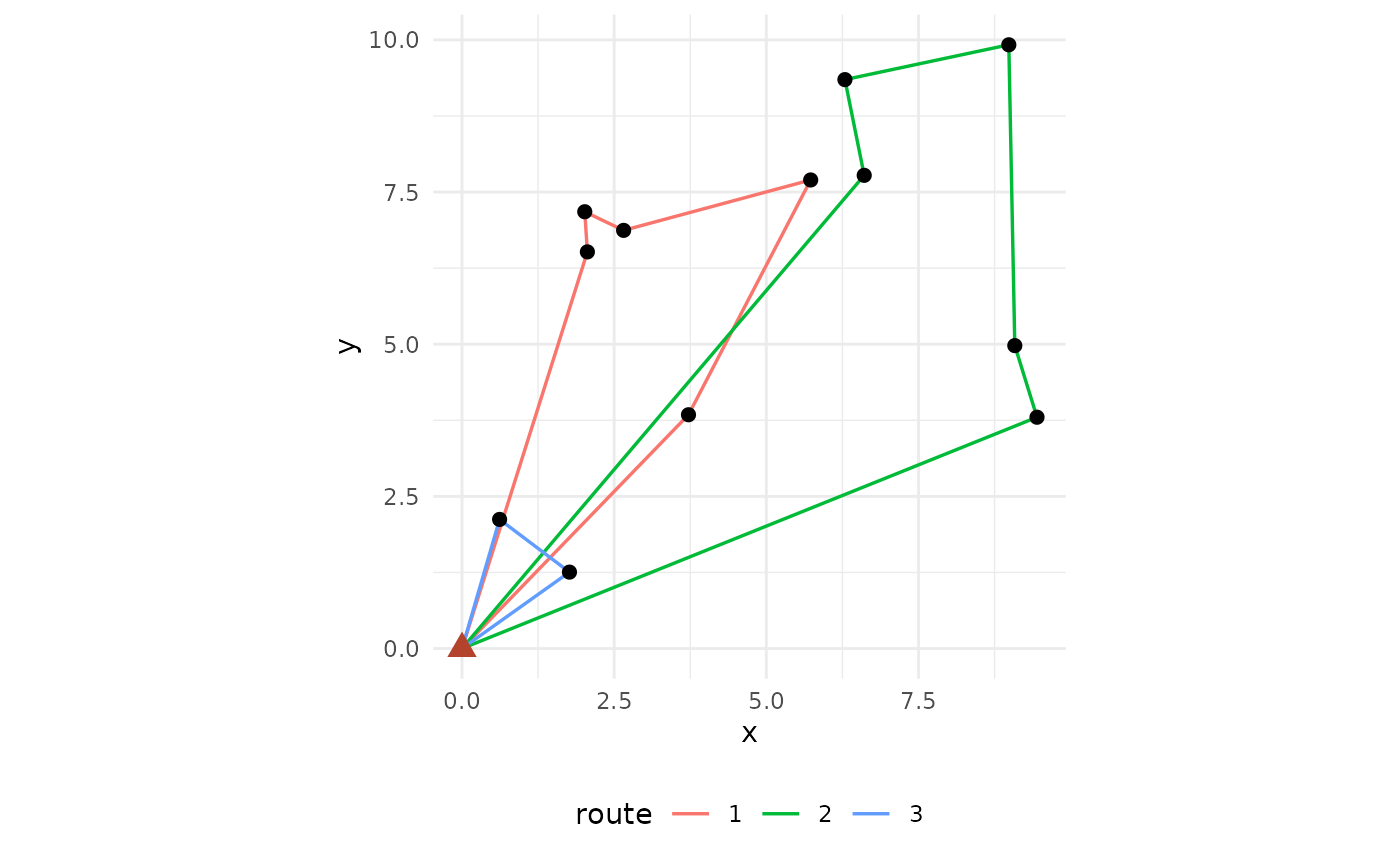
A ggplot with the units, the depot and the routes in the coordinate space of the travel matrix.
Examples
set.seed(1)
pts <- data.frame(
  unit = c("depot", paste0("s", 1:12)),
  x = c(0, runif(12, 0, 10)), y = c(0, runif(12, 0, 10))
)
r <- route_fieldwork(travel_matrix(pts, method = "euclidean"), paste0("s", 1:12),
  depot = "depot", max_stops = 5, iterations = 50
)
autoplot(r)