Plot a sample of units
Usage
# S3 method for class 'fieldopt_sample'
autoplot(object, ...)Value
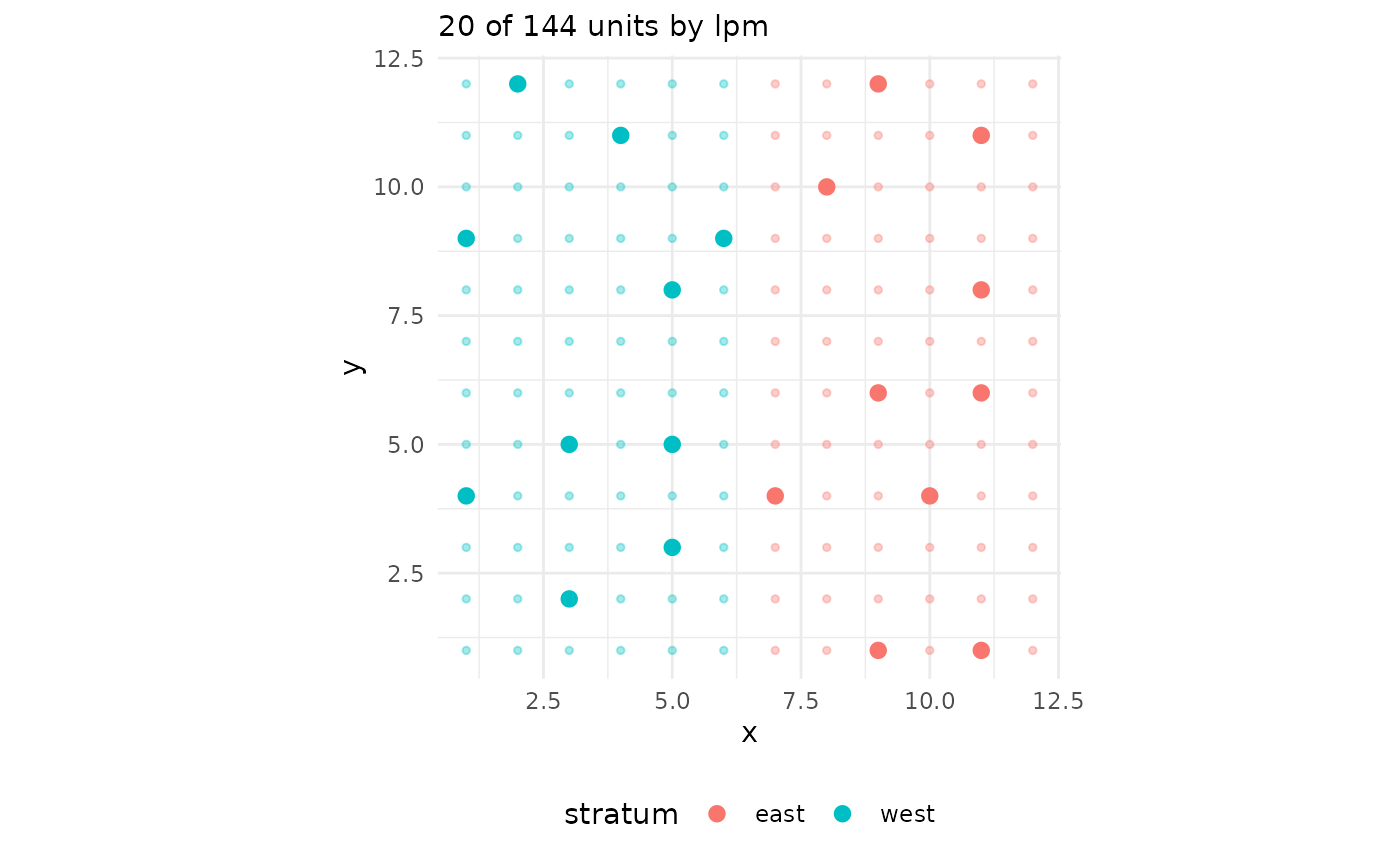
A ggplot of the frame with the sampled units highlighted, coloured by stratum when the sample is stratified, with longitude on the x axis for geographic coordinates.
Examples
cells <- expand.grid(x = 1:12, y = 1:12)
cells$h <- ifelse(cells$x <= 6, "west", "east")
autoplot(select_units(cells, n = 20, strata = "h", seed = 3))