
Ensemble consensus over the GRASP pool (LCDA-ECG)
Source:vignettes/ensemble-consensus.Rmd
ensemble-consensus.RmdWhy throw the pool away?
A multi-start search produces a whole pool of
diverse partitions, yet the GRASP/Reactive variants keep only the single
best-by-
solution. Following Ensemble Clustering for Graphs (Poulin &
Théberge, 2019), lcda_ecg() instead aggregates the pool:
the fraction of pool partitions in which two endpoints share a community
becomes an edge co-association weight, and the
reweighted graph is re-clustered for a consensus
partition. Three by-products come for free: a consensus leader,
a node-confidence map, and overlapping communities.
g <- igraph::make_graph("Zachary")
res <- lcda_ecg(g, B = 32, overlap = TRUE, tau = 0.6, seed = 1)
res
#>
#> ── LCDA-ECG (ensemble consensus) result ────────────────────────────────────────
#> communities: 4
#> modularity Q (input): 0.41979
#> Q (consensus weights): 0.588951
#> pool size B: 32
#> mean node confidence: 0.83
#> elapsed (s): 0.188
#> overlap nodes: 6 (tau = 0.6)
#> ℹ `lcda_metrics()` for the full metric table; `plot()` for the community-leader map.
cat("consensus leaders:", res$leaders, "\n")
#> consensus leaders: 1 6 34 25
cat("overlap (bridge) nodes:", which(res$is_overlap), "\n")
#> overlap (bridge) nodes: 1 5 6 7 10 11
Consensus closes the recovery gap
library(ggplot2); library(dplyr)
#>
#> Attaching package: 'dplyr'
#> The following objects are masked from 'package:stats':
#>
#>     filter, lag
#> The following objects are masked from 'package:base':
#>
#>     intersect, setdiff, setequal, union
rec$results$summary |>
  ggplot(aes(mu, NMI, colour = method, shape = method)) +
  geom_line(linewidth = 0.9) + geom_point(size = 2) +
  labs(title = "Recovery vs the planted LFR partition",
       subtitle = "LCDA-ECG matches ECG and outperforms Leiden (advantage at high mixing)",
       x = expression(mu), y = "NMI") +
  theme_minimal(base_size = 10) + theme(legend.position = "bottom")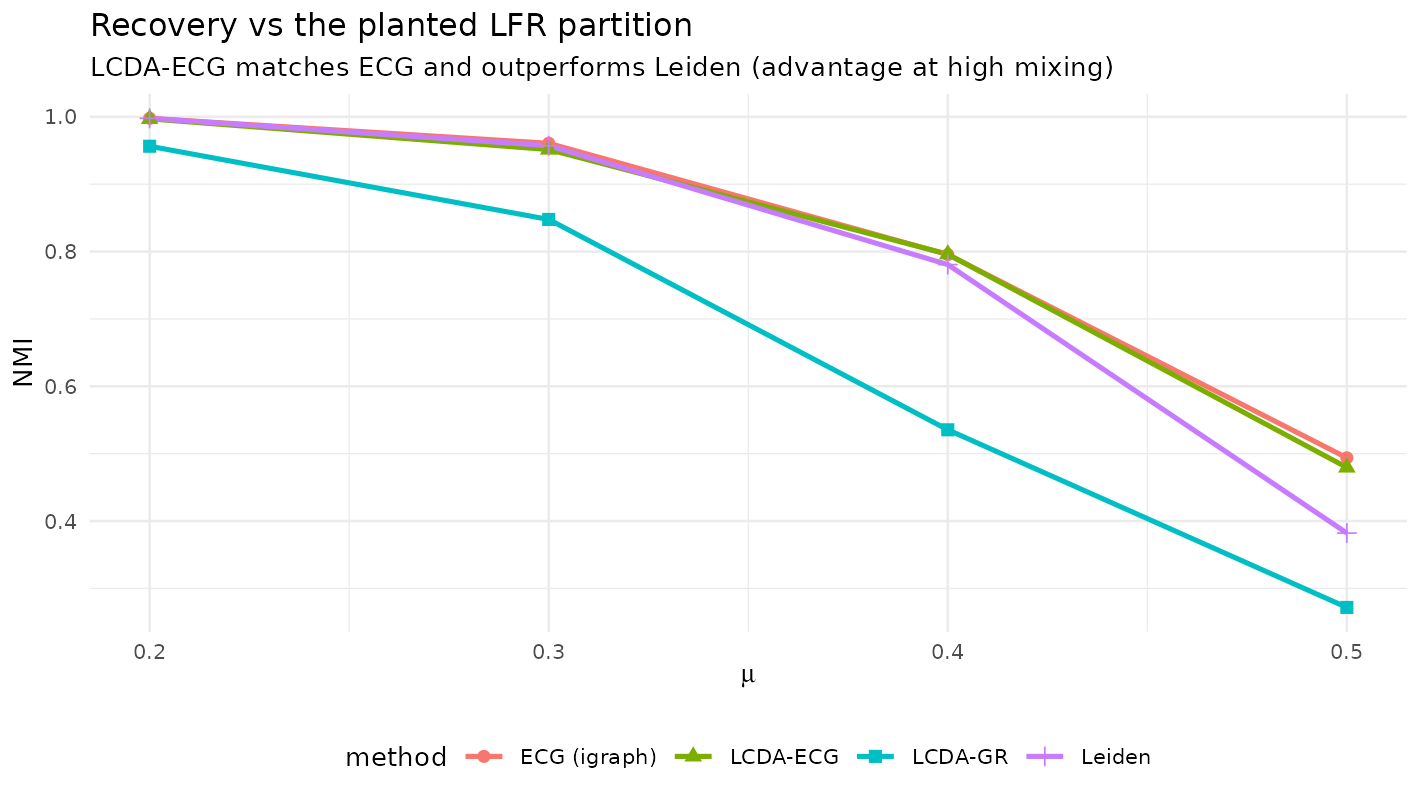
The fixed/Reactive variants trail Leiden and ECG on recovery; the ensemble-consensus variant LCDA-ECG matches ECG and overtakes Leiden in the high-mixing regime, where consensus is most valuable. (It stays on par with ECG rather than beating it.)
Overlapping nodes show bridge-like connectivity
ov$results$per_graph |>
  group_by(mu) |>
  summarise(`overlap node` = mean(P_overlap, na.rm = TRUE),
            `non-overlap node` = mean(P_nonoverlap, na.rm = TRUE), .groups = "drop") |>
  tidyr::pivot_longer(-mu, names_to = "kind", values_to = "P") |>
  ggplot(aes(factor(mu), P, fill = kind)) +
  geom_col(position = position_dodge(0.7), width = 0.65) +
  labs(title = "Participation coefficient of overlap vs non-overlap nodes",
       x = expression(mu), y = "participation coefficient", fill = NULL) +
  theme_minimal(base_size = 10) + theme(legend.position = "bottom")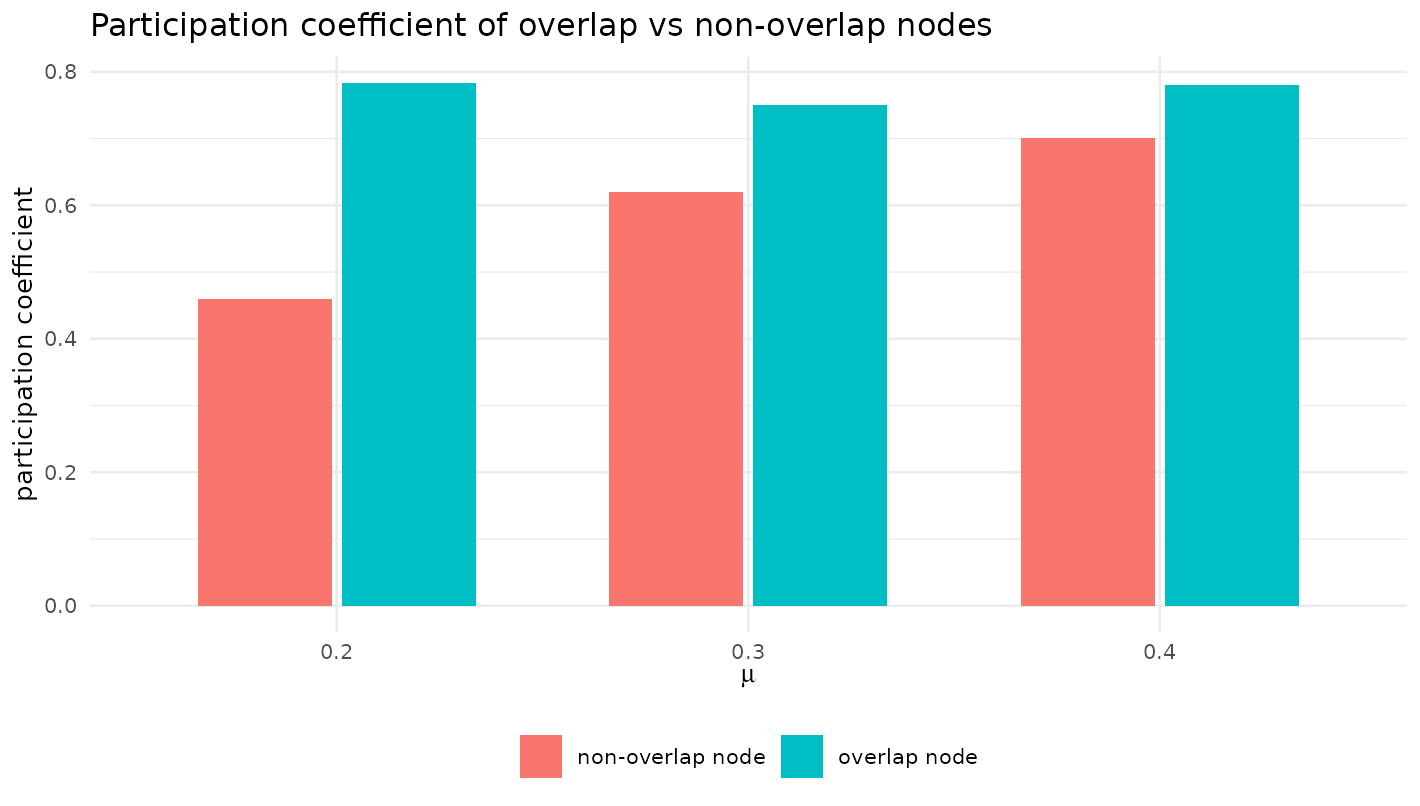
Nodes that LCDA-ECG places in more than one community have a significantly higher participation coefficient (their edges spread across communities), i.e. bridge-like connectivity. Because both the participation coefficient and the overlap-assignment rule read the same node-to-community edge distribution, this is a consistency check rather than an independent validation.
The pool stabilises (so the pool size is principled)
st$results |>
  group_by(B) |>
  summarise(`co-assoc drift` = mean(coassoc_drift, na.rm = TRUE),
            `consensus stability` = mean(consensus_stability, na.rm = TRUE),
            `recovery` = mean(recovery), .groups = "drop") |>
  tidyr::pivot_longer(-B, names_to = "metric", values_to = "value") |>
  ggplot(aes(B, value, colour = metric)) +
  geom_line(linewidth = 0.9) + geom_point(size = 1.5) +
  scale_x_continuous(trans = "log2", breaks = c(2, 4, 8, 16, 32, 64, 128)) +
  labs(title = "Co-association converges as the pool grows",
       x = "pool size B (log2)", y = NULL, colour = NULL) +
  theme_minimal(base_size = 10) + theme(legend.position = "bottom")
#> Warning: Removed 2 rows containing missing values or values outside the scale range
#> (`geom_line()`).
#> Warning: Removed 2 rows containing missing values or values outside the scale range
#> (`geom_point()`).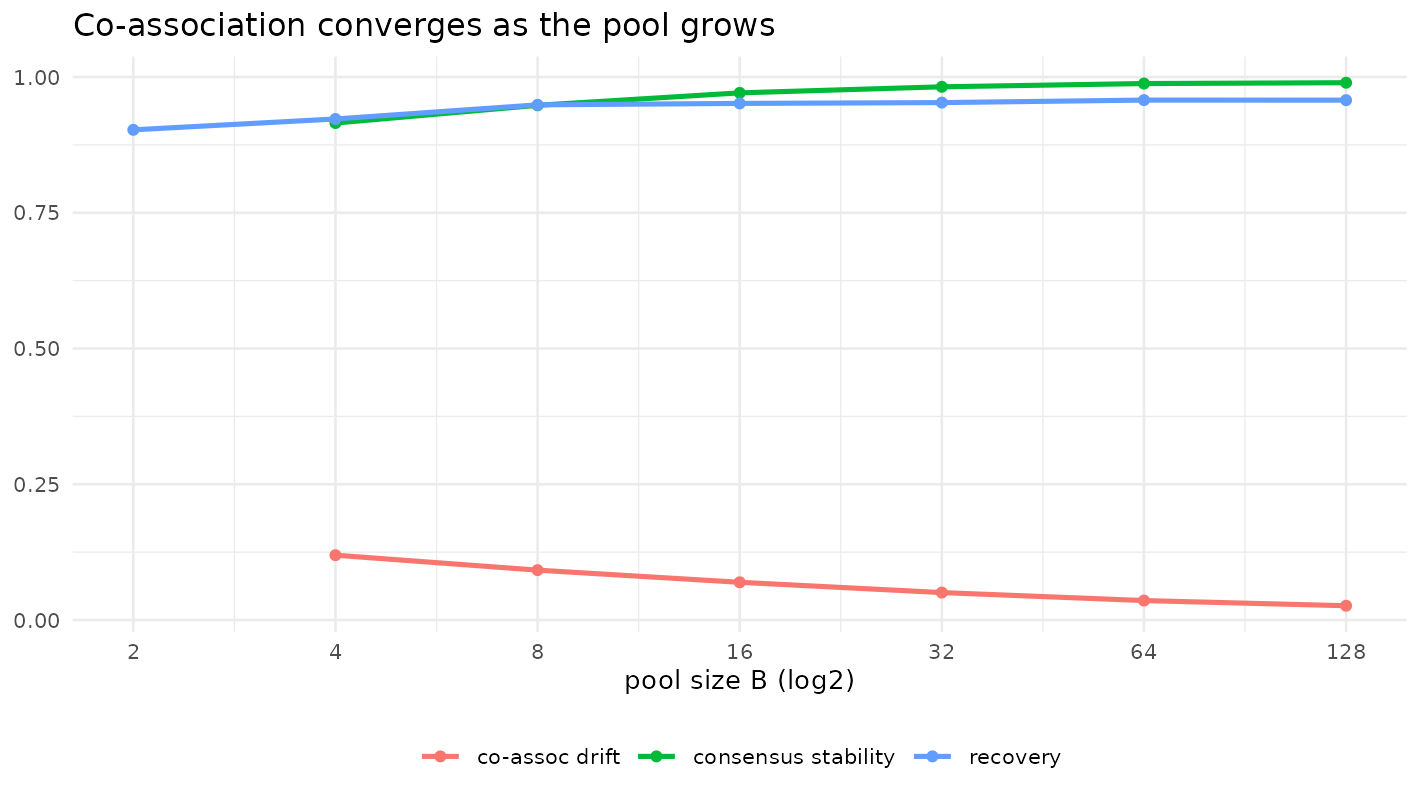
As grows the co-association drift vanishes and both the consensus partition and its recovery plateau by — a stability-based stopping rule, consistent with the asymptotic concentration of the Reactive update.
Reproducibility and data provenance
Every figure above is read from datasets shipped with the package;
nothing is simulated at build time. Each dataset records the package
version that generated it (not necessarily the version
you installed: the generators are re-run only when the algorithms
change), the release it first shipped in, and a SHA-256 checksum
matching inst/extdata/SHA256SUMS:
do.call(rbind, lapply(c("lcda_ecg", "overlap_lcda_ecg", "stability_pool"),
                      lcda_provenance))
#>            dataset generated_by generated_on first_release shipped_in
#> 1         lcda_ecg        0.3.1   2026-05-31         0.3.1      0.3.2
#> 2 overlap_lcda_ecg        0.3.1   2026-05-31         0.3.1      0.3.2
#> 3   stability_pool        0.3.1   2026-05-31         0.3.1      0.3.2
#>                                                             sha256
#> 1 21a96e3f8a41022f1402b8060666cd4a9b7814341e90e3d614badfde6ba7d031
#> 2 9e87fd947cefe6331fa4e88fde3460b44eb919dd11f932d3f0c3ed9e9e3be90b
#> 3 468b06a04023591fd3e009f6833c2eff1ba6bdca0018363dd183586e643c595f
Regenerate with data-raw/97_lcda_ecg.R,
data-raw/99_overlap_lcda_ecg.R and
data-raw/100_stability_pool.R (each fixes a single
documented seed).
Scope and honest reading. LCDA-ECG is competitive with ECG — which remains marginally ahead on pure recovery — and overtakes Leiden only at high mixing (). The overlapping-community result is a consistency check (overlap nodes are structural bridges), not a validation against planted overlap, which the disjoint LFR generator does not provide.
References
- Poulin, V., & Théberge, F. (2019). Ensemble clustering for graphs. Applied Network Science, 4, 51. doi:10.1007/s41109-019-0162-z