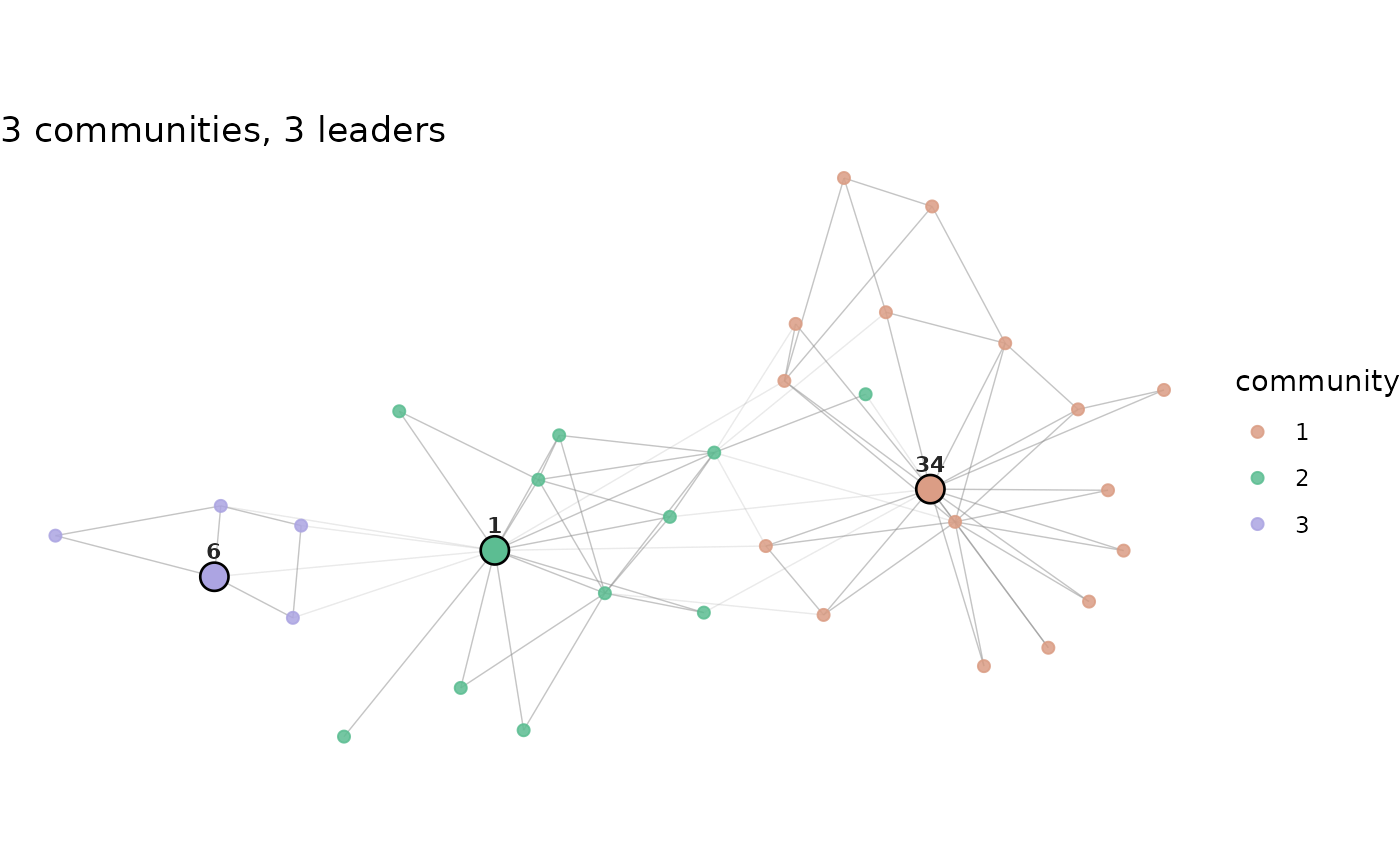
[ggplot2::autoplot()] methods for the fitted LCDA results: the same figure as [plot.lcda_grasp_result()], returned as a `ggplot` object so it can be themed, faceted, or saved with [ggplot2::ggsave()]. Requires the suggested package ggplot2.
Usage
# S3 method for class 'lcda_grasp_result'
autoplot(object, graph = NULL, layout = NULL, ...)

# S3 method for class 'lcda_gr_result'
autoplot(object, graph = NULL, layout = NULL, ...)

# S3 method for class 'lcda_ecg_result'
autoplot(object, graph = NULL, layout = NULL, ...)
Arguments
- object
a fitted `lcda_grasp_result`, `lcda_gr_result` or `lcda_ecg_result`.
- graph
optional [igraph::igraph] to draw on; defaults to the graph stored in `object`. Simplified before drawing, exactly as in [plot.lcda_grasp_result()].
- layout
optional layout matrix or layout function; defaults to Fruchterman-Reingold.
- ...
further arguments passed to the internal renderer (`leader_labels`, `palette`, `vertex_size`, `leader_size`, `title`).
Examples
if (requireNamespace("ggplot2", quietly = TRUE)) {
  g <- igraph::make_graph("Zachary")
  res <- lcda_grasp(g, B = 20, seed = 1)
  set.seed(1)
  ggplot2::autoplot(res)
}