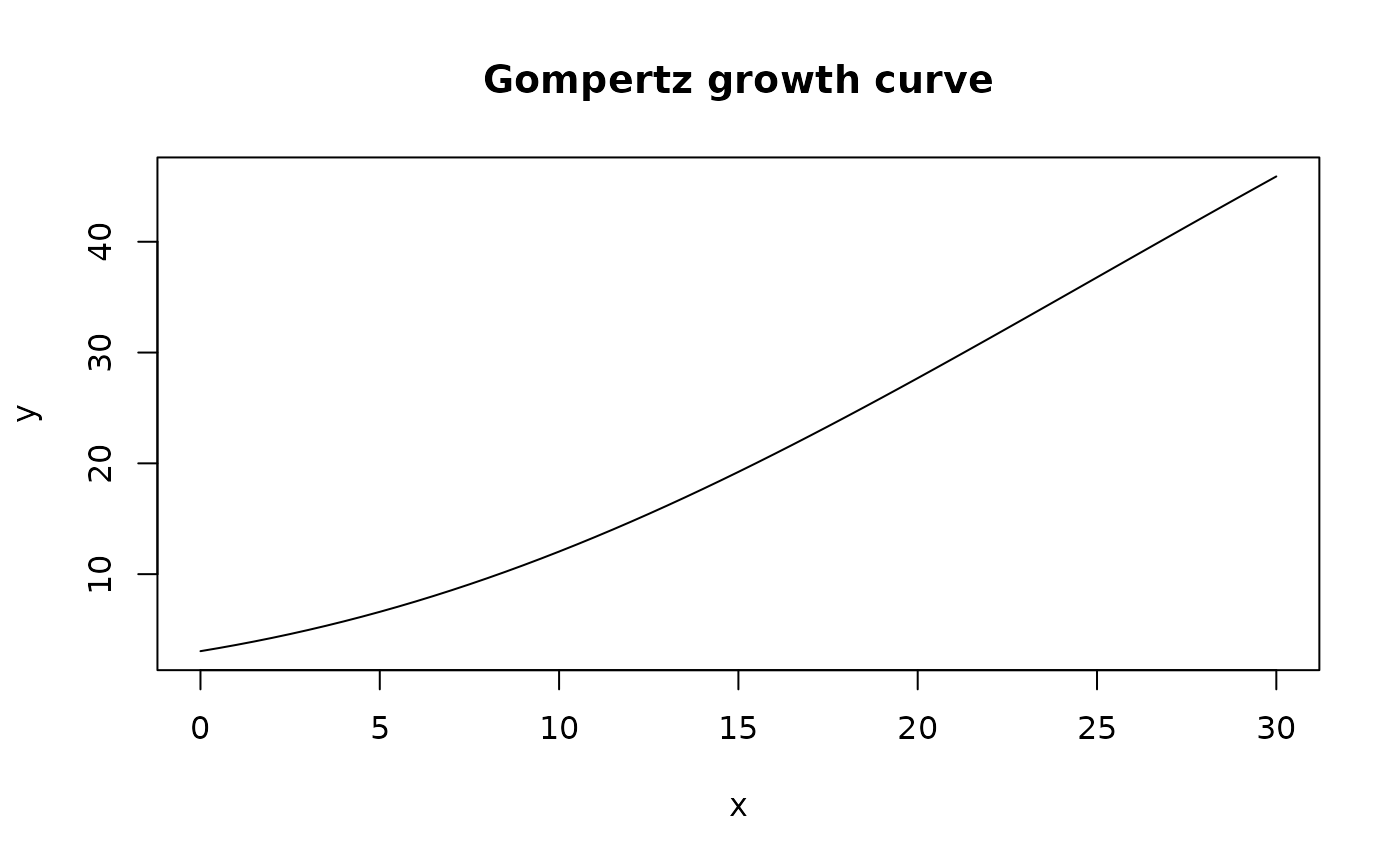
Computes the value of the Gompertz curve parameterised in terms of starting value, asymptote, growth rate and lag: $$G(x) = y_0 + (y_{\max} - y_0)\, \exp\!\left[-\exp\!\left(\frac{k\,e\,(\mathrm{lag} - x)}{y_{\max} - y_0} + 1\right)\right].$$
Details
This parameterisation, often called the "Zwietering Gompertz" form
after Zwietering et al. (1990, eq. 3), gives directly interpretable
parameters: y0 is the lower asymptote, ymax the upper
asymptote, k the maximum growth rate (the slope of the curve at
its inflection point), and lag the lag time (where the tangent
at the inflection point crosses y0). The factor \(e\) is what
makes k the maximum slope; versions of shewhartr up to 1.3.0
omitted it, so their curves had maximum slope \(k/e\).
References
Gompertz, B. (1825). On the Nature of the Function Expressive of the Law of Human Mortality. Philosophical Transactions of the Royal Society of London, 115, 513-583.
Zwietering, M. H., Jongenburger, I., Rombouts, F. M., & van 't Riet, K. (1990). Modeling of the Bacterial Growth Curve. Applied and Environmental Microbiology, 56(6), 1875-1881. doi:10.1128/aem.56.6.1875-1881.1990
See also
SSgompertzDummy() for an nls-friendly self-starting
variant that allows a covariate shift.