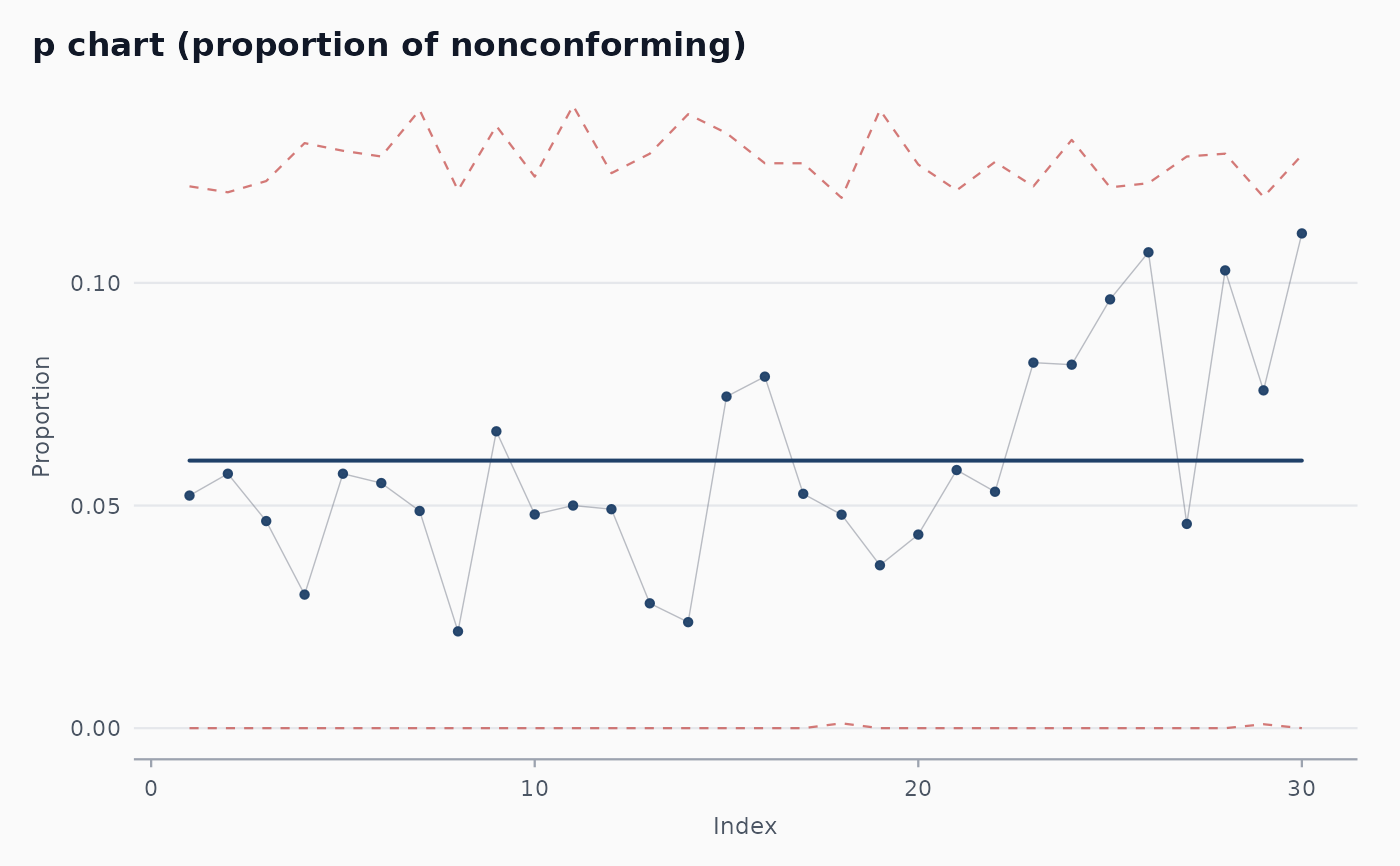
A synthetic dataset of 30 days. Each day, a variable number of claims is processed (80-150) and the count of claims with errors is recorded. Underlying error rate is 5% for the first 22 days and 9% thereafter.
Format
A tibble with 30 rows and 3 columns:
- day
Integer day index (1-30).
- n
Integer total claims processed that day.
- defects
Integer claims found with errors.
Examples
fit <- shewhart_p(claims_p, defects = defects, n = n, index = day)
# \donttest{
ggplot2::autoplot(fit)

# }
# }