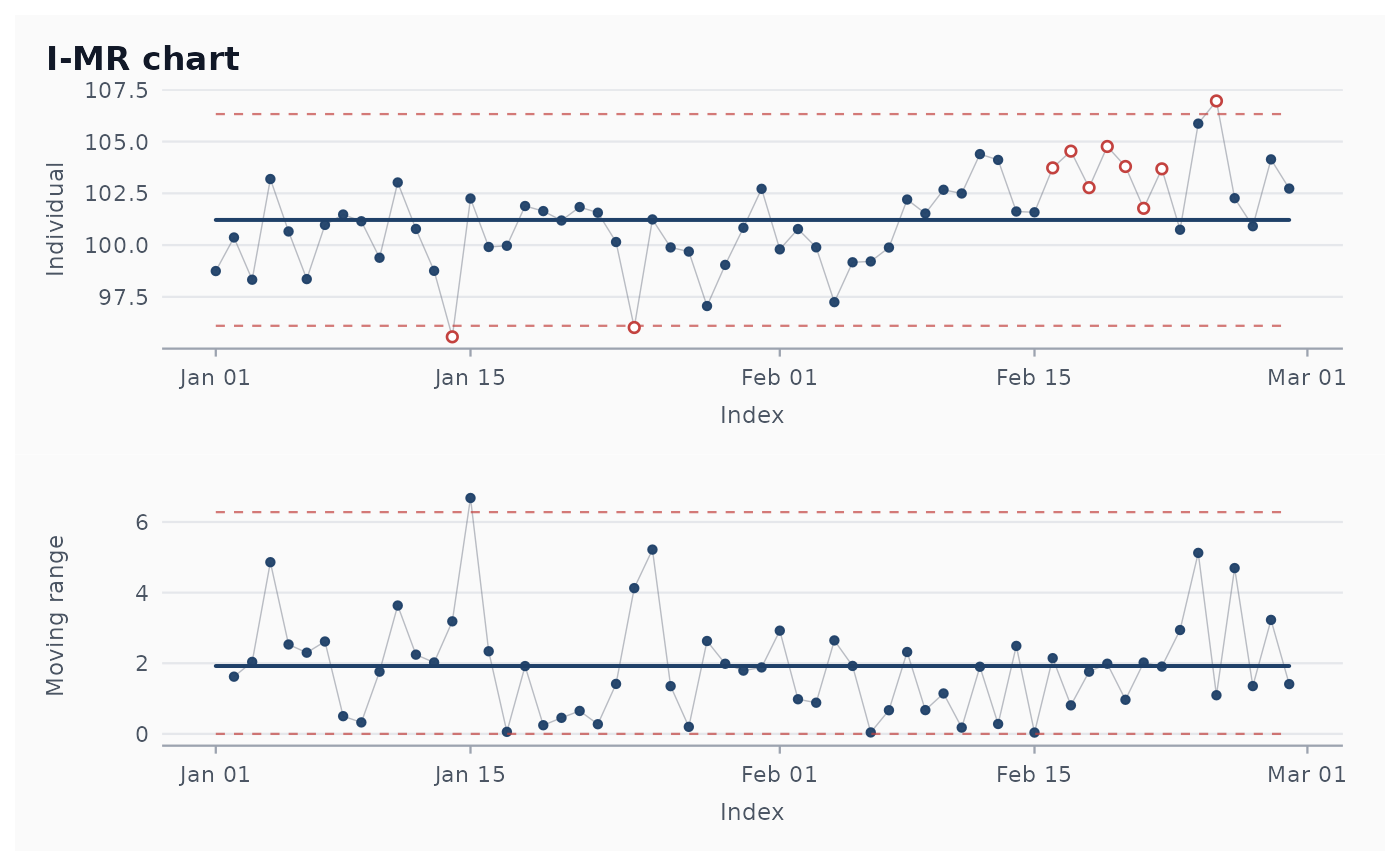
Constructs an I-MR chart for a single column of individual
measurements. Returns a shewhart_chart object that supports
print(), summary(), autoplot(), tidy(), glance() and
augment().
Arguments
- data
A data frame.
- value
Tidy-eval column reference for the measurement.
- index
Optional tidy-eval column reference for the x-axis (date or integer). If
NULL(default), the row index is used.- sigma_method
One of
"mr"(default; classical moving range),"median_mr"(Tukey-style robust: median of moving ranges, with bias correction),"biweight"(Tukey biweight midvariance),"sd"(sample SD).- rules
Character vector of rule keys to apply. See
shewhart_rules_available(). Default applies Nelson 1 and 2.- locale
One of
"en","pt","es","fr". Affects plot labels and informative messages.- verbose
Logical. Print progress messages? Defaults to the
shewhart.verboseoption.
Value
A shewhart_chart object of subclass shewhart_i_mr.
Details
Sigma is estimated from the moving range with d2(2) = 1.128; the
classical 3-sigma limits are equivalent to
x_bar +/- 2.660 * MR_bar. The MR chart limits are
[0, D4(2) * MR_bar] with D4(2) = 3.267.
References
Montgomery, D. C. (2019). Introduction to Statistical Quality Control (8th ed.). Wiley. Chapter 6.
Wheeler, D. J., & Chambers, D. S. (1992). Understanding Statistical Process Control (2nd ed.). SPC Press.
Examples
set.seed(1)
df <- data.frame(
  day = seq.Date(as.Date("2024-01-01"), by = "day", length.out = 60),
  y   = c(rnorm(40, mean = 100, sd = 2),
          rnorm(20, mean = 103, sd = 2))   # shift after position 40
)
fit <- shewhart_i_mr(df, value = y, index = day)
print(fit)
#>
#> ── Shewhart chart I-MR (individuals & moving range) ────────────────────────────
#> • Observations / subgroups: 60
#> • Phase: "phase_1"
#> • Sigma estimate ("mr"): 1.704
#>
#> ── Control limits ──
#>
#> # A tibble: 6 × 3
#>   chart line   value
#>   <chr> <chr>  <dbl>
#> 1 I     CL    101.
#> 2 I     UCL   106.
#> 3 I     LCL    96.1
#> 4 MR    CL      1.92
#> 5 MR    UCL     6.28
#> 6 MR    LCL     0
#> ── Rule violations ──
#>
#> ! 10 violations across 2 rules.
#> nelson_1_beyond_3s: 3 hits.
#> nelson_2_nine_same: 7 hits.
# \donttest{
ggplot2::autoplot(fit)
#> Warning: Removed 1 row containing missing values or values outside the scale range
#> (`geom_line()`).
#> Warning: Removed 1 row containing missing values or values outside the scale range
#> (`geom_point()`).

# }
# }