Generic autoplot method that dispatches on chart subclass. All
versions return a ggplot object that the user can further
customise with the usual ggplot2 grammar.
Usage
autoplot.shewhart_chart(
  object,
  show_violations = TRUE,
  show_sigma_zones = FALSE,
  locale = NULL,
  ...
)
Arguments
- object
A shewhart_chart object.
- show_violations
Logical. Highlight violations with red points? Default
TRUE.- show_sigma_zones
Logical. Show 1- and 2-sigma zones as shaded bands? Default
FALSE.- locale
Optional override for the chart's stored locale.
- ...
Passed to subclass-specific methods.
Value
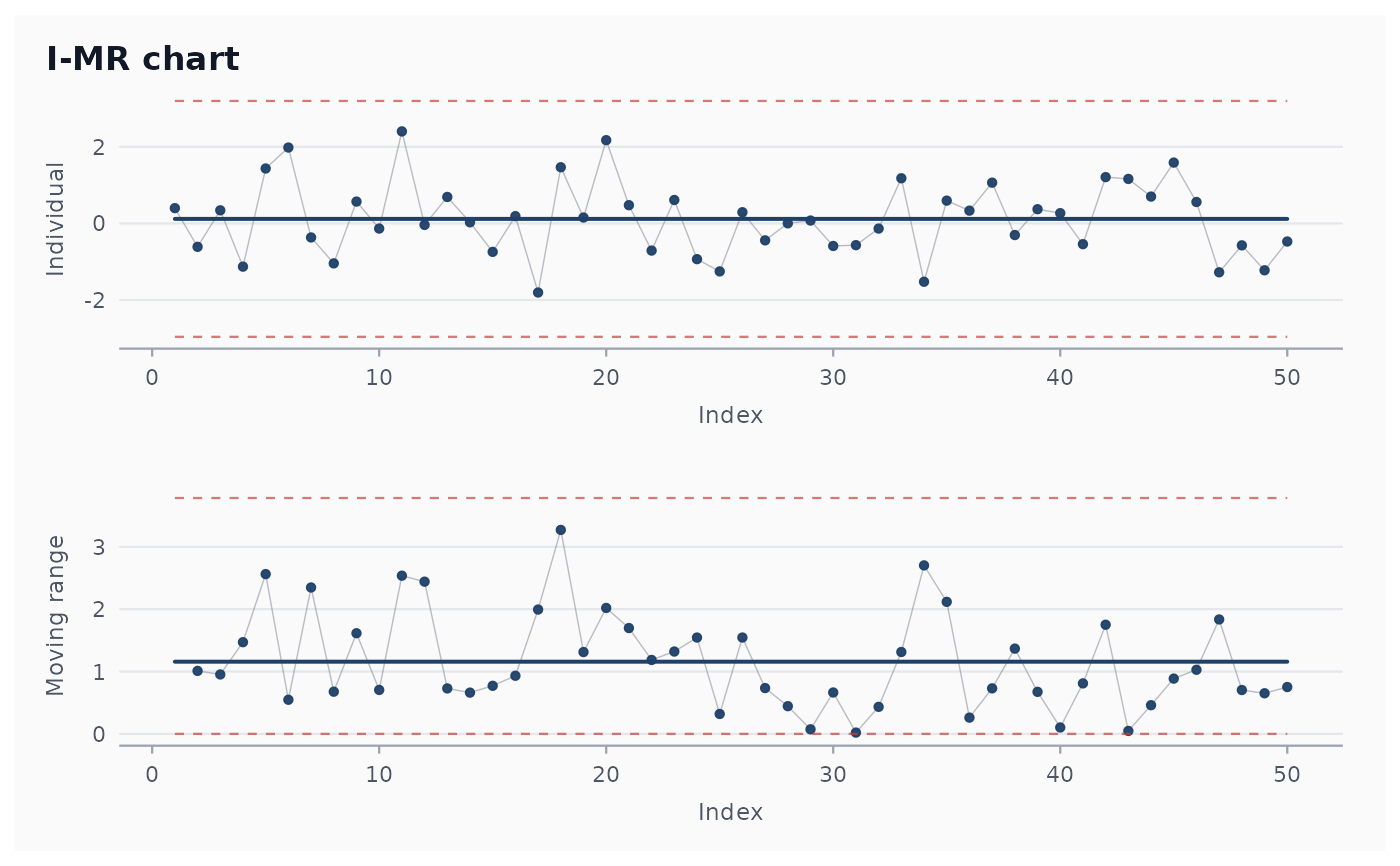
A ggplot object (or, for I-MR / Xbar-R / Xbar-S charts,
a list of two ggplot objects with class shewhart_plot_pair
that prints them stacked).
Examples
# \donttest{
fit <- shewhart_i_mr(data.frame(y = rnorm(50)), value = y)
ggplot2::autoplot(fit)
#> Warning: Removed 1 row containing missing values or values outside the scale range
#> (`geom_line()`).
#> Warning: Removed 1 row containing missing values or values outside the scale range
#> (`geom_point()`).

# }
# }