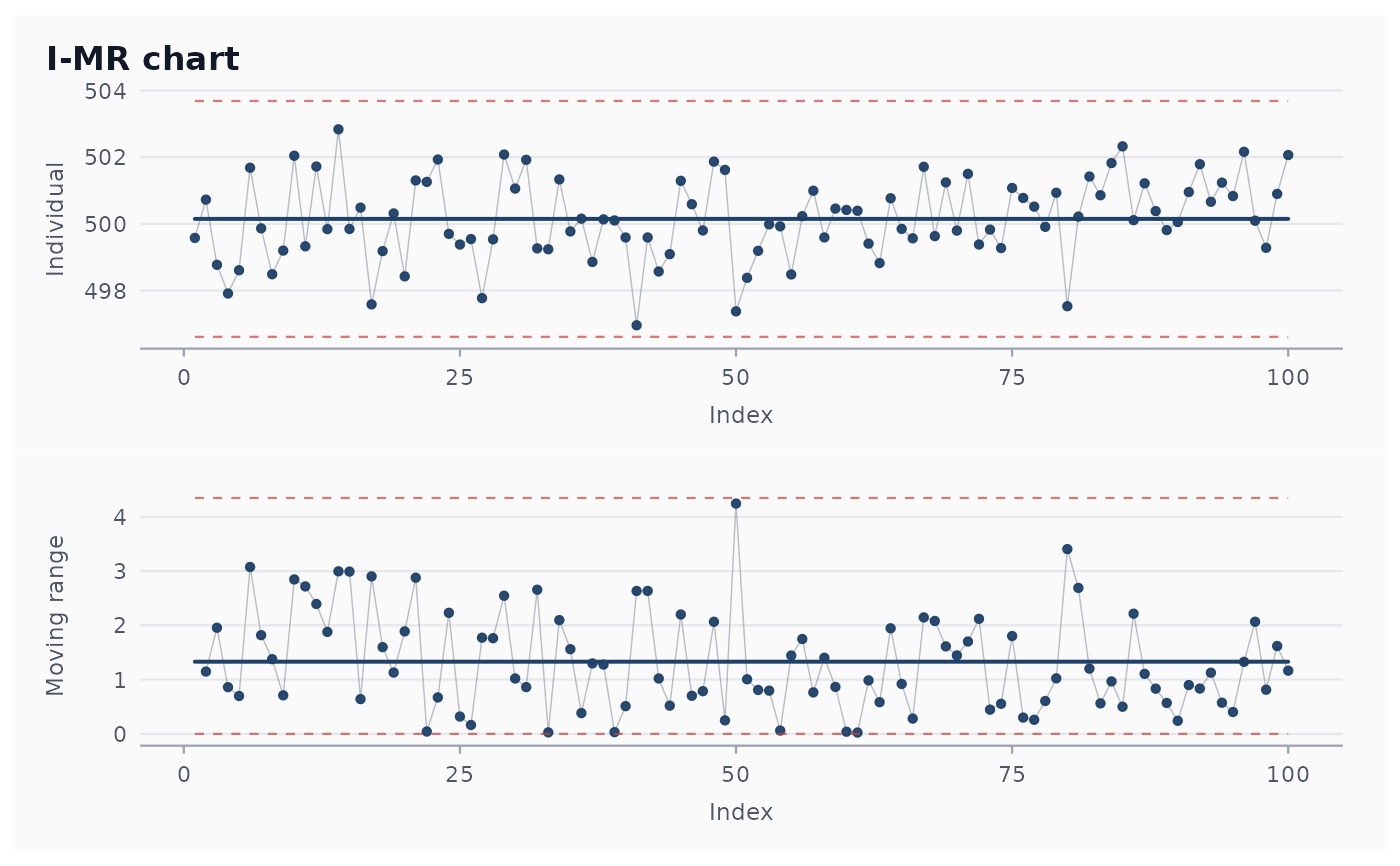
A synthetic dataset of 100 individual fill volumes (in millilitres). Process target is 500 ml with sigma 1.2 ml. A linear drift begins around observation 65, simulating a slowly miscalibrating filler.
Format
A tibble with 100 rows and 2 columns:
- observation
Integer observation index.
- ml
Numeric volume in millilitres.
Examples
fit <- shewhart_i_mr(bottle_fill, value = ml, index = observation)
# \donttest{
ggplot2::autoplot(fit)
#> Warning: Removed 1 row containing missing values or values outside the scale range
#> (`geom_line()`).
#> Warning: Removed 1 row containing missing values or values outside the scale range
#> (`geom_point()`).

# }
# }