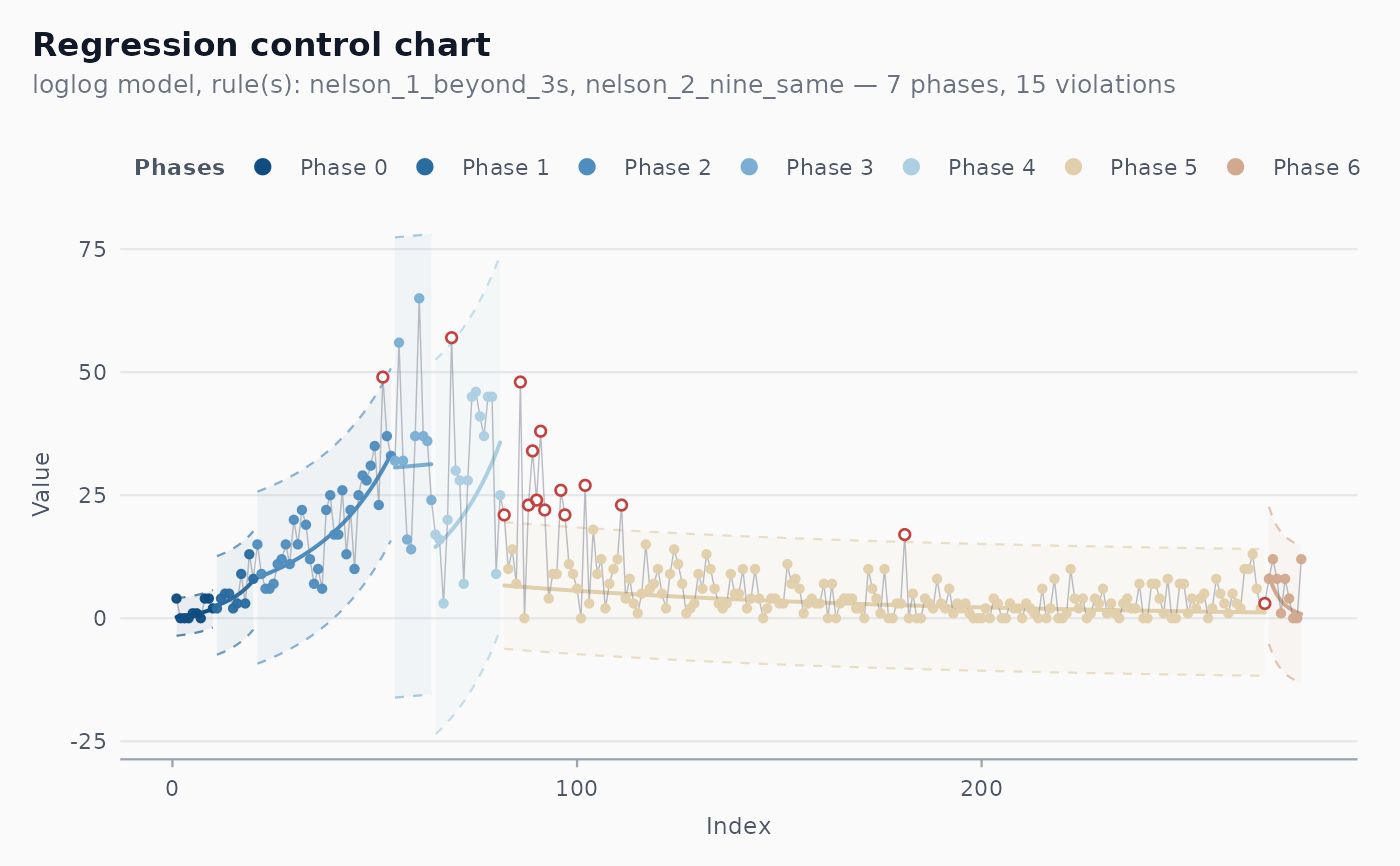
Daily count of new COVID-19 deaths officially recorded in Recife
(capital of Pernambuco state, Brazil) between 28 March 2020 and
31 December 2020. Distributed with v0.1.x as
inst/extdata/recife_2020_covid19.rds and preserved in v1.0.0
as a vignette case study illustrating the regression-based control
chart on non-stationary epidemiological counts.
Format
A tibble with 279 rows and 3 columns:
- date
Date of the bulletin.
- new_deaths
Integer count of new deaths reported that day.
- .t
Integer row index (1..N), useful as a continuous predictor for
shewhart_regression().
Source
Castlab (Universidade Federal de Pernambuco) compiled the original series from the Brazilian Ministry of Health daily bulletins. See https://covid.saude.gov.br/.
Examples
# \donttest{
fit <- shewhart_regression(cvd_recife,
                           value = new_deaths, index = .t,
                           model = "loglog")
ggplot2::autoplot(fit)

# }
# }