For chart objects whose residuals are meaningful (shewhart_i_mr,
shewhart_xbar_r, shewhart_xbar_s, shewhart_regression),
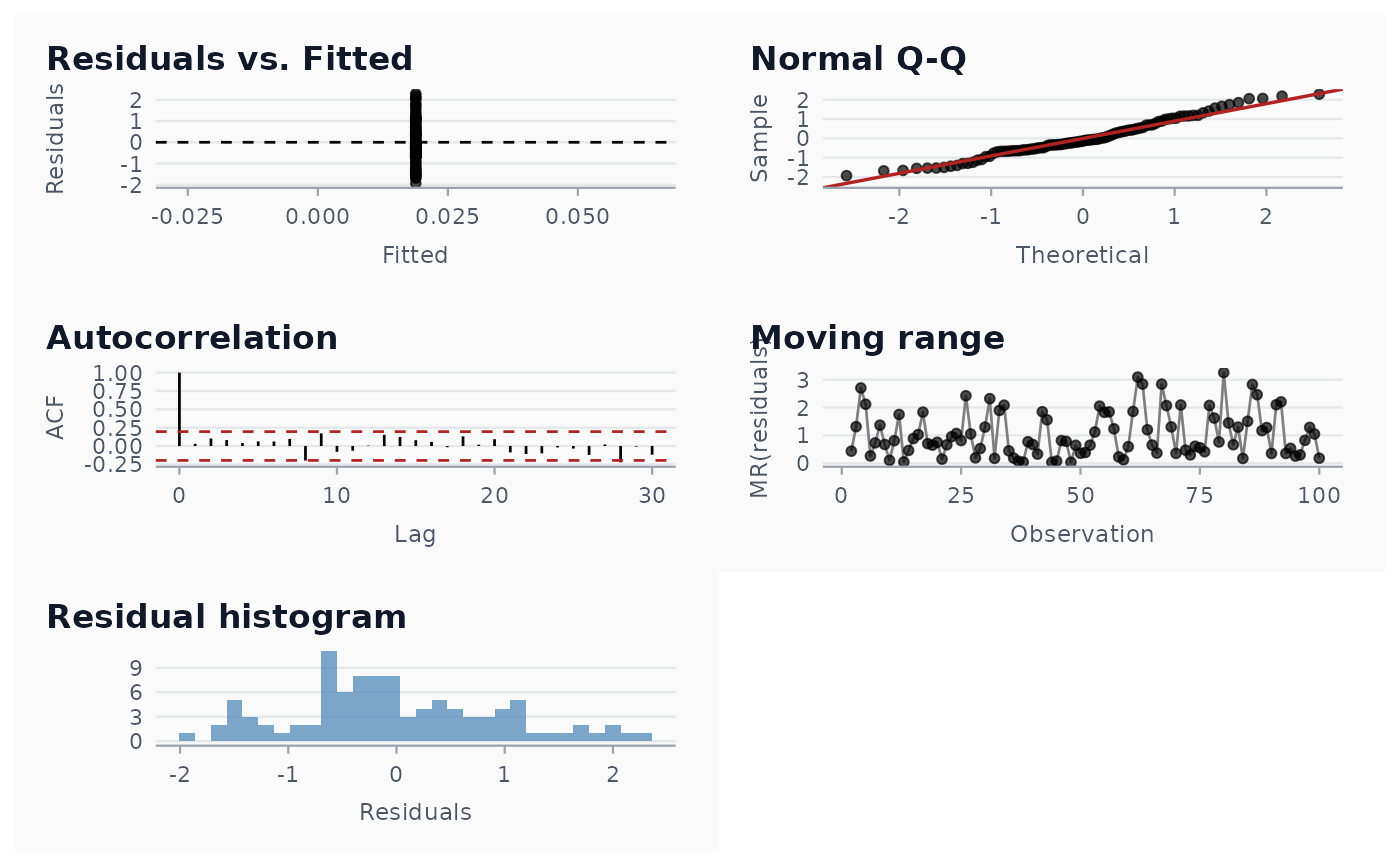
produces the five-panel residual diagnostic favoured by exploratory
data analysis: residuals vs. fitted, normal Q-Q, autocorrelation,
moving-range plot of residuals, residual histogram. The aim is to
make the assumptions that the chart is making visible: independence
(ACF), normality (Q-Q, histogram), constant variance (residuals
vs. fitted), and the absence of trend in dispersion (moving range).
Arguments
- chart
A shewhart_chart object.
- locale
Optional override for the chart's stored locale.
Value
A list of ggplot objects with class
shewhart_diagnostics. The print method composes the panels.
References
Tukey, J. W. (1977). Exploratory Data Analysis. Addison-Wesley.
Box, G. E. P., Hunter, W. G., & Hunter, J. S. (2005). Statistics for Experimenters: Design, Innovation, and Discovery (2nd ed.). Wiley.
Examples
# \donttest{
fit <- shewhart_i_mr(data.frame(y = rnorm(100)), value = y)
print(shewhart_diagnostics(fit))
#> Warning: Removed 1 row containing missing values or values outside the scale range
#> (`geom_line()`).
#> Warning: Removed 1 row containing missing values or values outside the scale range
#> (`geom_point()`).

# }
# }