A synthetic dataset of optical density (OD) measurements from a bacterial culture, sampled at 80 evenly spaced time points across a 24-hour incubation. The true mean follows a Gompertz growth curve with asymptote 1.2.
Format
A tibble with 80 rows and 2 columns:
- hour
Numeric time in hours since inoculation.
- od
Numeric optical density at 600 nm.
See also
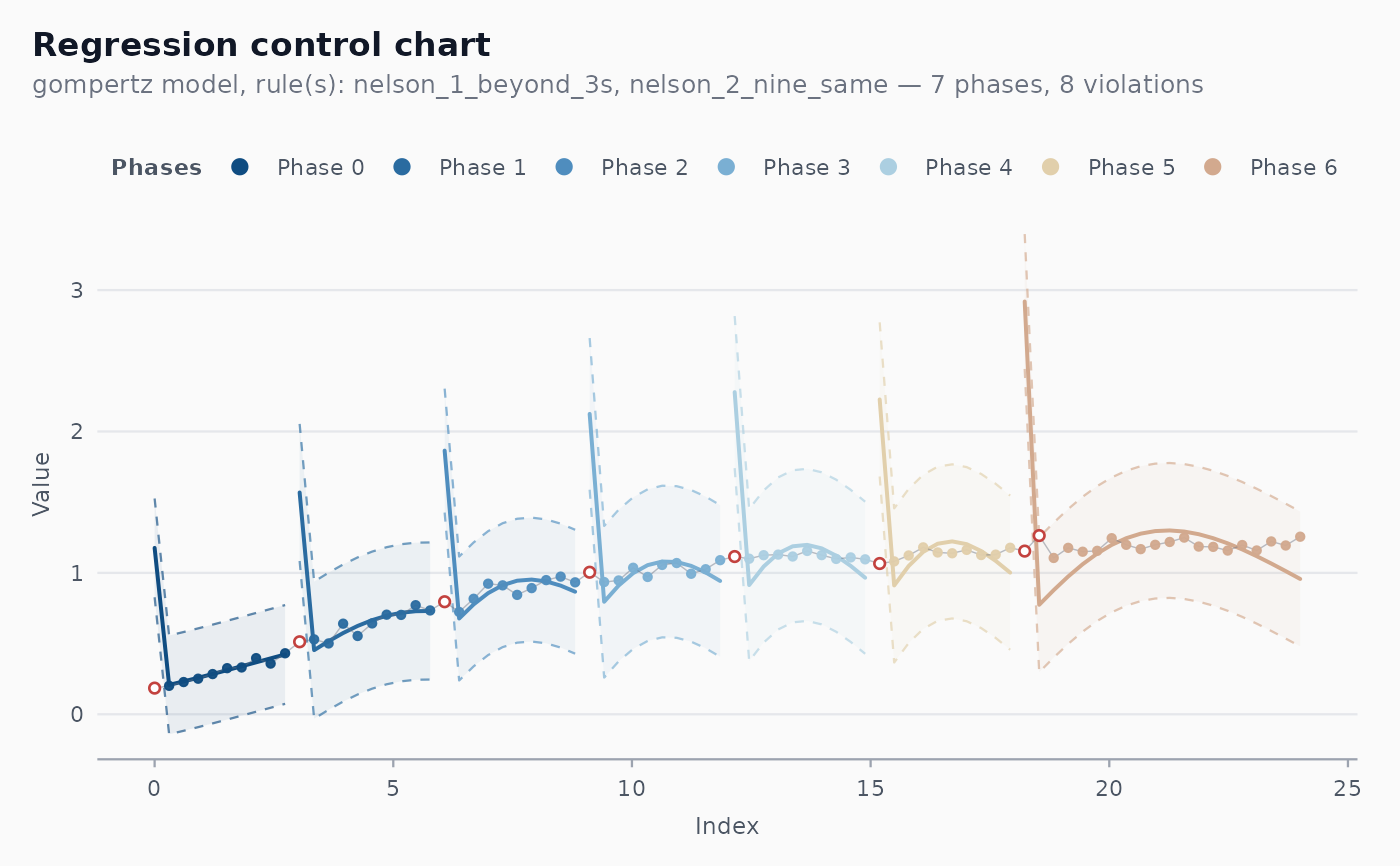
shewhart_regression() with model = "gompertz",
Gompertz().
Examples
# \donttest{
fit <- shewhart_regression(bacterial_growth,
                           value = od, index = hour,
                           model = "gompertz")
ggplot2::autoplot(fit)

# }
# }